

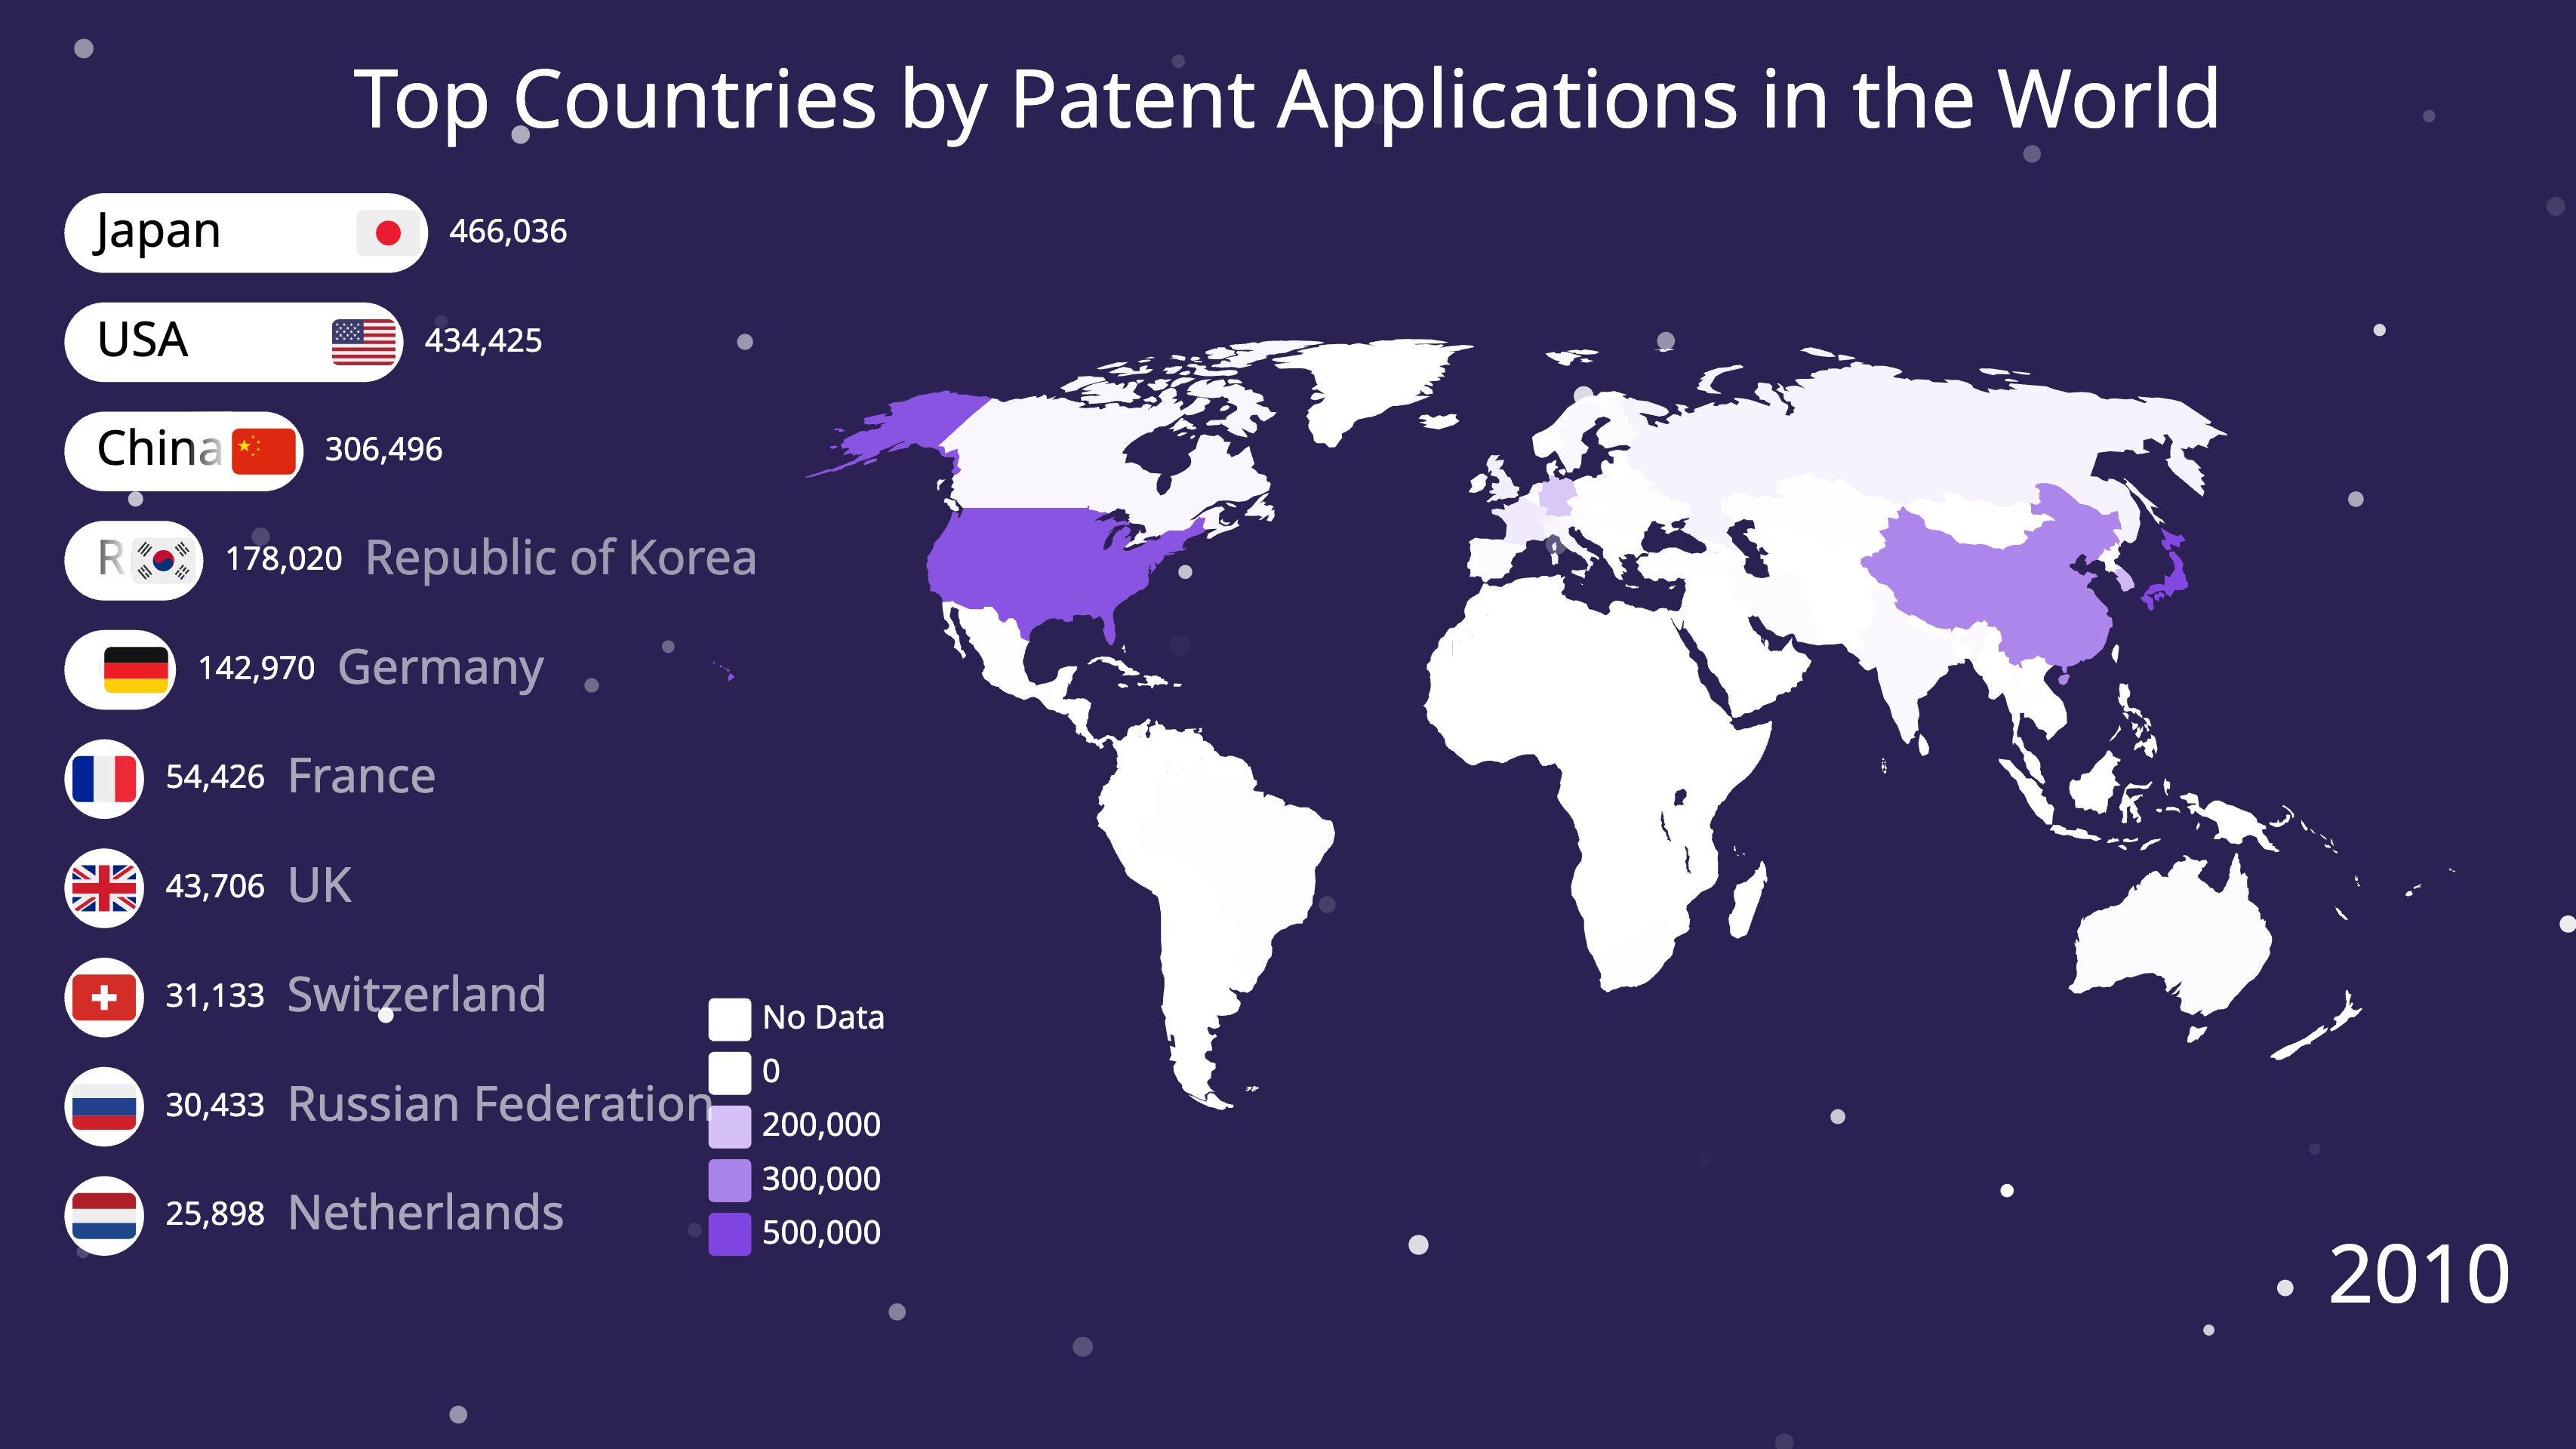
"Animated chart software" and "animated chart video software" sound like the same category, but they are not. Most data visualization tools produce an interactive chart that lives in a browser. If you are editing a YouTube video, a TikTok, or a client presentation, you need something different: a video file, in the right aspect ratio, at the right frame rate.
This guide covers the tools that actually produce that file, what each one is built for, and how to avoid the screen-recording trap.
What to look for
Before the list, the four things that separate these tools in practice:
- Direct video export vs. screen recording. This is the big one. If a tool only publishes an interactive embed, getting an MP4 means playing it full-screen and recording your own display. That caps you at your monitor's resolution and frame rate and risks dropped frames and stray cursor movement. Direct export renders the file properly, independent of your screen.
- Data-driven vs. presentation animation. Data-driven animation means the chart moves because the numbers change over time — bars overtaking each other, lines extending, a map filling in. Presentation animation means a finished chart fades or slides into view. Both are useful; they are not interchangeable.
- Aspect ratio. Short-form social video is 9:16. Many charting tools assume a landscape web embed.
- Resolution and frame rate. 1080p/30 is fine for most uses; 4K/60 matters if you are scaling, cropping, or doing slow motion in an edit.
The tools
1. Alien Art Charts
Best for: data-driven chart videos for social and YouTube.
Alien Art is built specifically to turn a spreadsheet into a video. Import a CSV, XLSX, Wikipedia table, or pasted data, pick a chart type, style it, and export an MP4 from the browser — no screen recording, no After Effects, no motion design experience.
- Chart types: bar chart race, line chart race, pie chart race, table chart race, animated maps, tornado and comparison charts, plus static infographic output.
- Video export: direct MP4, up to 4K/60 FPS on the paid plan. The free plan covers 30 minutes of exports per month at up to Full HD/30 FPS with a watermark.
- Composition: layers let you stack multiple charts, text, images, and audio into a single video.
- Aspect ratios: configurable, including vertical for short-form.
- Requirements: a web browser; works on mobile.
2. Flourish
Best for: interactive animated charts for the web.
Flourish has one of the deepest template libraries in data visualization and is widely used in newsrooms. Its animated templates are genuinely excellent. The caveat for video work is the export ladder: per its pricing page, Free and Presenter plans export images only, Publisher adds HTML, and video export is Enterprise-only. Below Enterprise, an MP4 means screen recording.
- Video export: Enterprise plans only.
- Pricing: free tier available, with public projects and attribution.
3. Adobe After Effects
Best for: full creative control, when you have the time and skills.
After Effects is the ceiling for what an animated chart can look like — every property is animatable and you can match any brand style exactly. It is also the steepest learning curve and the slowest workflow, and it has no native understanding of a dataset. Data-driven charts generally require expressions, a CSV/JSON import, or a third-party script or template.
- Video export: yes, any format and resolution.
- Pricing: Creative Cloud subscription.
4. Wondershare Filmora
Best for: adding a simple chart to a video you are already editing.
Filmora is a general-purpose video editor with built-in chart and data visualization templates. If you are already cutting your video in Filmora, adding a chart there avoids a round trip. The chart templates are less specialized than a dedicated data tool, and complex time-series races are not really its territory.
- Video export: yes, it is a video editor.
- Pricing: paid, with a watermarked free trial.
5. Canva
Best for: a chart inside a social graphic you are already designing.
Canva is the most widely used tool on this list, and it does export MP4 — so it clears the bar the rest of this article is about. Its charts are a design element rather than a data feature: you paste or upload data, pick a chart, and animate it with the same entrance and transition effects you would apply to any other object. That makes it strong for a single chart in a branded social post, and weak for a time-series race, which it has no concept of.
- Video export: MP4, up to 4K on paid plans.
- Animation: presentation-style object effects, not data-driven.
- Pricing: free plan exports at 1080p; Pro adds 4K and brand controls.
6. Visme
Best for: animated charts inside presentations and infographics.
Visme is a design platform covering presentations, infographics, and documents, with charting and object animation built in. The animation is presentation-style rather than data-driven, which suits a marketing deck or a social infographic more than a time-series race.
- Video export: MP4 on paid plans.
- Pricing: limited free plan; paid plans unlock downloads.
7. Vizzu
Best for: developers building animated charts into their own products.
Vizzu is an open-source JavaScript library (with a Python wrapper) built around animated transitions between chart states. Excellent if you want charts inside an application and are comfortable in code. It is a library, so there is no video export — you would render the canvas yourself or record it.
- Video export: not built in.
- Pricing: free and open source.
Quick comparison
| Tool | Direct video export | Max quality | Skill level | Animation style |
|---|---|---|---|---|
| Alien Art Charts | Yes, MP4 from browser | 4K / 60 FPS | Beginner | Data-driven |
| Flourish | Enterprise plan only | Screen-dependent below Enterprise | Beginner | Data-driven |
| Adobe After Effects | Yes, any format | Limited by render settings | Advanced | Manual / scripted |
| Wondershare Filmora | Yes, it is a video editor | 4K | Beginner | Template-based |
| Canva | Yes, MP4 | 4K on paid plans | Beginner | Presentation-style |
| Visme | Yes, paid plans | 1080p | Beginner | Presentation-style |
| Vizzu | No, it is a library | Whatever you render | Developer | Data-driven |
Plan details were last checked on 11 August 2026. Export tiers change often — confirm on the vendor's own pricing page before you buy.
How to choose
- Time-series data as a video for social or YouTube — a dedicated data-to-video tool like Alien Art Charts.
- An interactive chart for a web page — Flourish.
- A fully bespoke, brand-matched animation with budget and time — After Effects.
- One simple chart in a video you are already editing — Filmora.
- A chart inside a branded social graphic — Canva.
- A chart in a slide deck or infographic — Visme.
- Charts inside your own app — Vizzu.
The main thing to check before committing to any tool: confirm that it exports a video file on the plan you intend to pay for. That single detail is where most of these tools actually differ, and it is easy to discover too late.
If you are specifically weighing a move away from Flourish, we go deeper on that trade-off in Flourish alternatives for animated data visualizations.
Frequently asked questions
What is animated chart video software?
Software that turns a dataset into an animated chart and renders it as a video file (usually MP4) that you can drop into a video edit or upload to social platforms. It differs from general charting tools, which typically produce a static image or an interactive web embed.
Can I make animated chart videos for free?
Yes. Alien Art Charts includes 30 minutes of exports per month on its free plan at up to Full HD, with a watermark. Flourish is free to use but only exports video on Enterprise plans, so free-tier users have to screen-record.
Do I need After Effects to make animated charts?
No. After Effects gives the most control, but dedicated data-to-video tools handle bar chart races, line races, and animated maps without any motion design work. After Effects is worth it when you need a fully bespoke look that a template cannot produce.
What resolution and format should I export for social media?
MP4 (H.264) at 1080p is the safe default everywhere. Use 9:16 vertical for TikTok, Reels, and Shorts, and 16:9 for YouTube. Export at 60 FPS if the animation is fast-moving or you plan to slow any of it down in an edit.